System-level design for mission-critical, data-heavy decision workflows

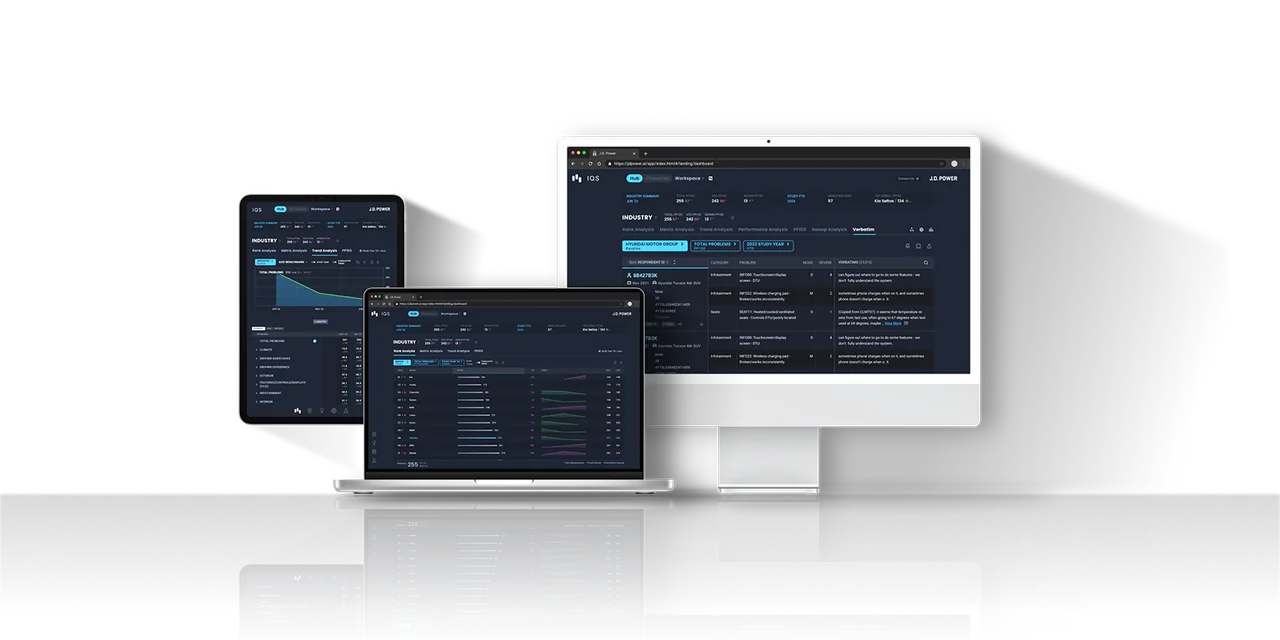
PROBLEM
The challenge wasn’t visual clarity alone, but designing interaction models that remain predictable across scale, hierarchy, and system constraints.
CONTEXT
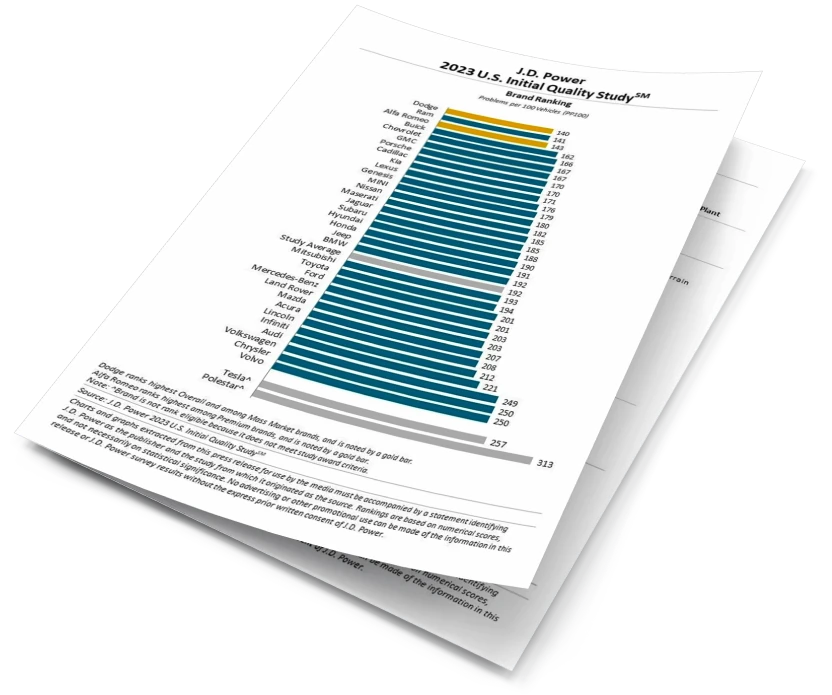
Legacy Format:
For decades, IQS results were distributed as static PDFs and custom PowerPoint decks. These reports offered consistency and authority across automakers, but the experience was fundamentally one-directional — data came pre-packaged, insights fixed, and updates slow to arrive.
Limitations:
Without interactivity or real-time updates, analysts couldn’t trace the “why” behind quality shifts.
Cross-dataset comparisons and early issue detection required manual work, making the platform less adaptive to today’s rapid feedback cycles.
Through user feedback, we learned that analysts struggled with slow and rigid data tools. The redesign focused on making access faster, insights smarter, and the system sustainable for long-term growth.
⚡
Real-Time
Data became instantly accessible, enabling live tracking and continuous quality monitoring instead of static, delayed reviews.
🔍
Interactive
Dynamic filters and drill-down tools let analysts explore datasets freely and uncover insights from multiple perspectives.
🌱
Sustainable
A scalable data framework ensured long-term growth while keeping the focus on consistent vehicle quality improvement.
CHALLENGE
SOLUTION
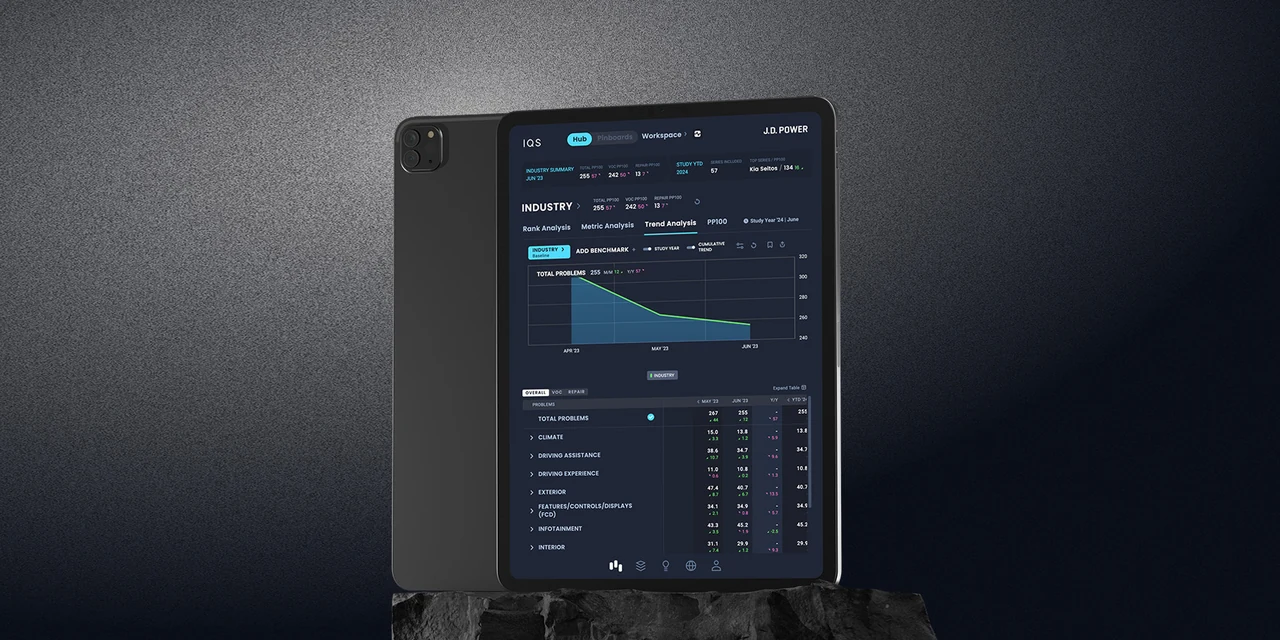
To tackle the challenge of scattered and overwhelming datasets, I reimagined IQS as a modular suite of analytical tools. Each module was built to address a specific layer of complexity—from high-level rankings to deep-dive metric exploration—enabling analysts to move fluidly between overview and detail.
Together, these modules turned fragmented data into an intuitive, connected ecosystem for faster, clearer decision-making.
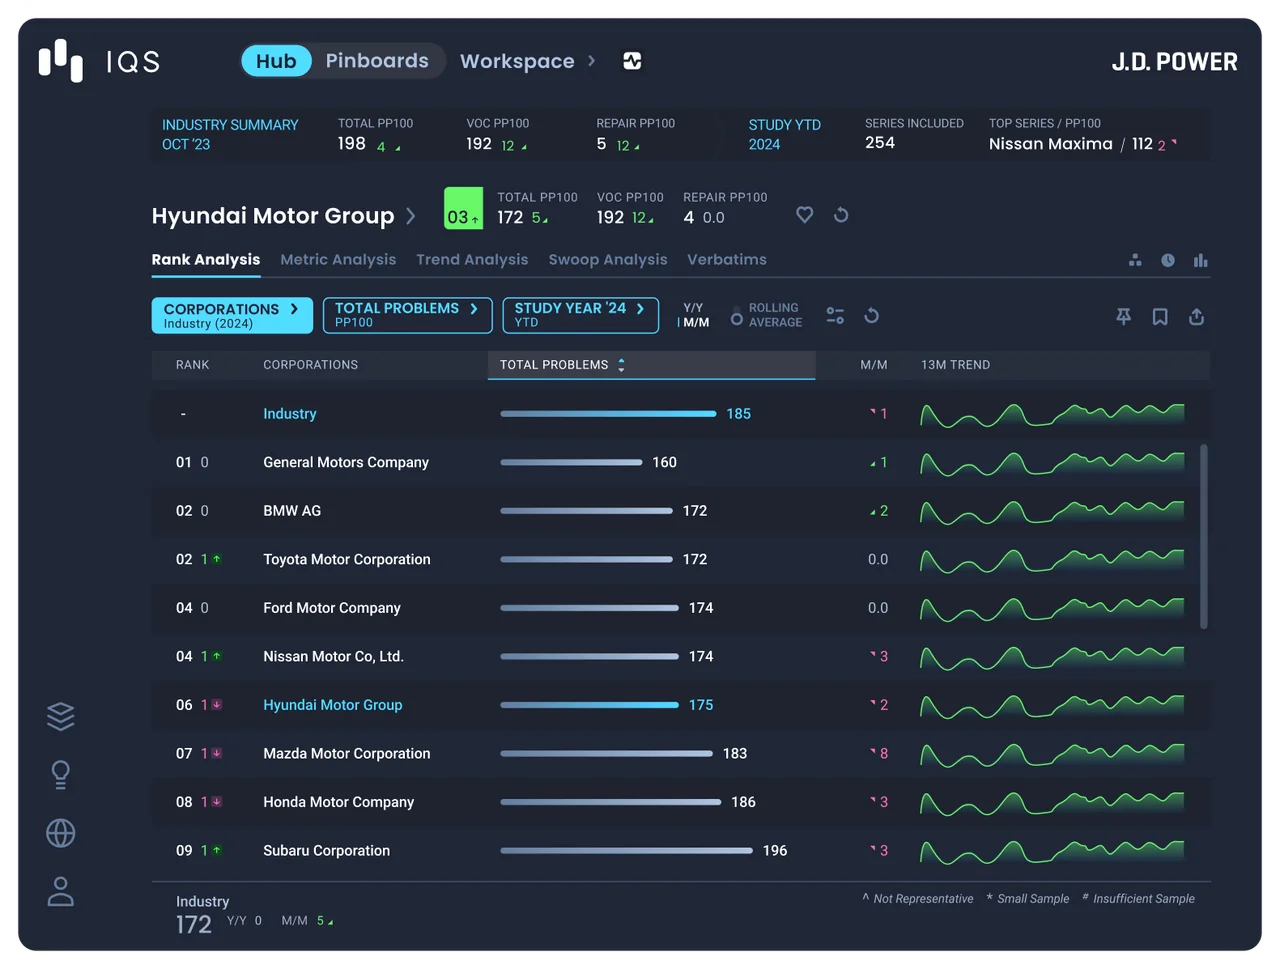
Rank Analysis
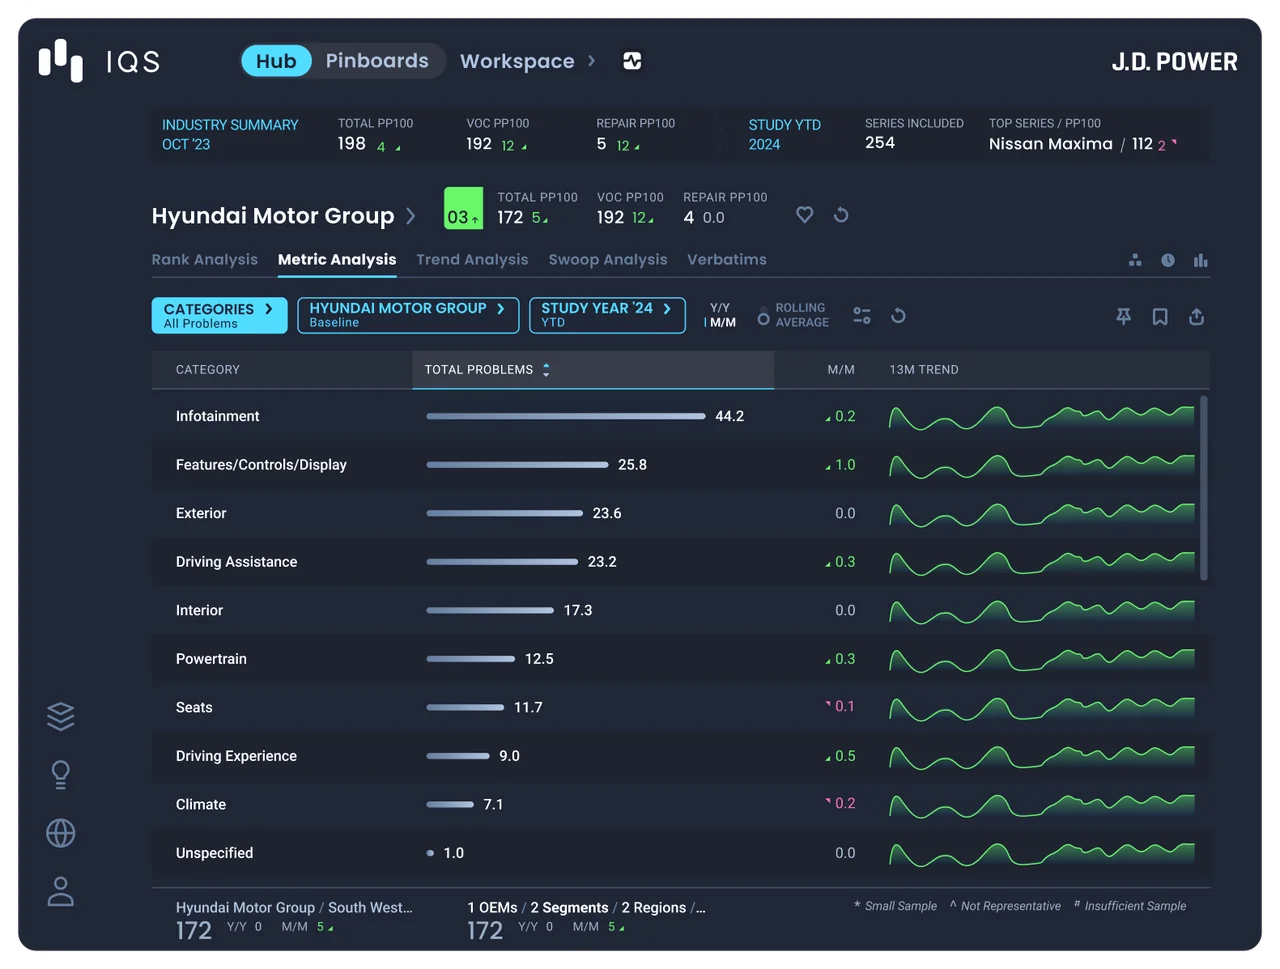
Metric Analysis
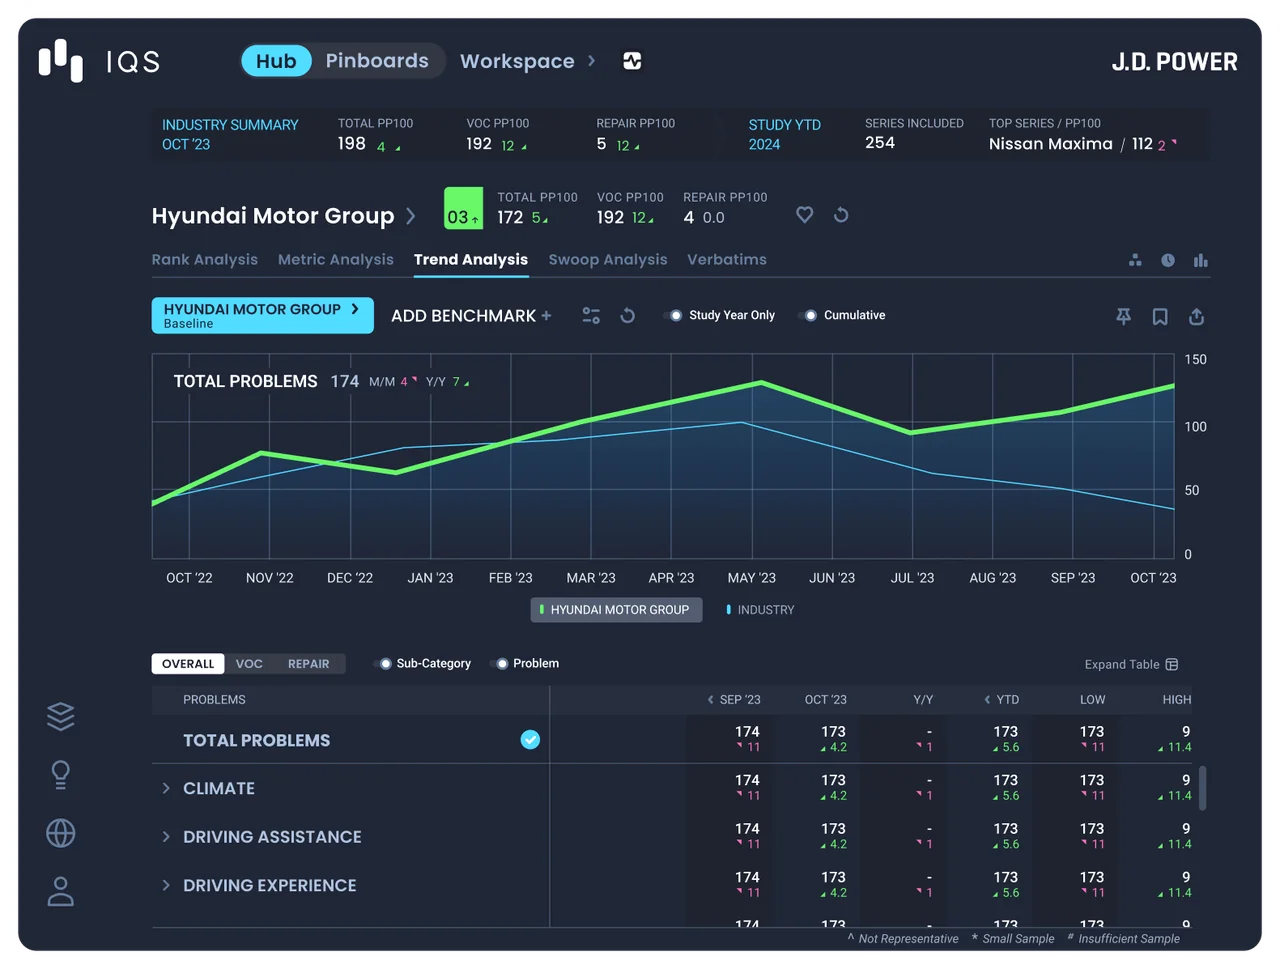
Trend Analysis
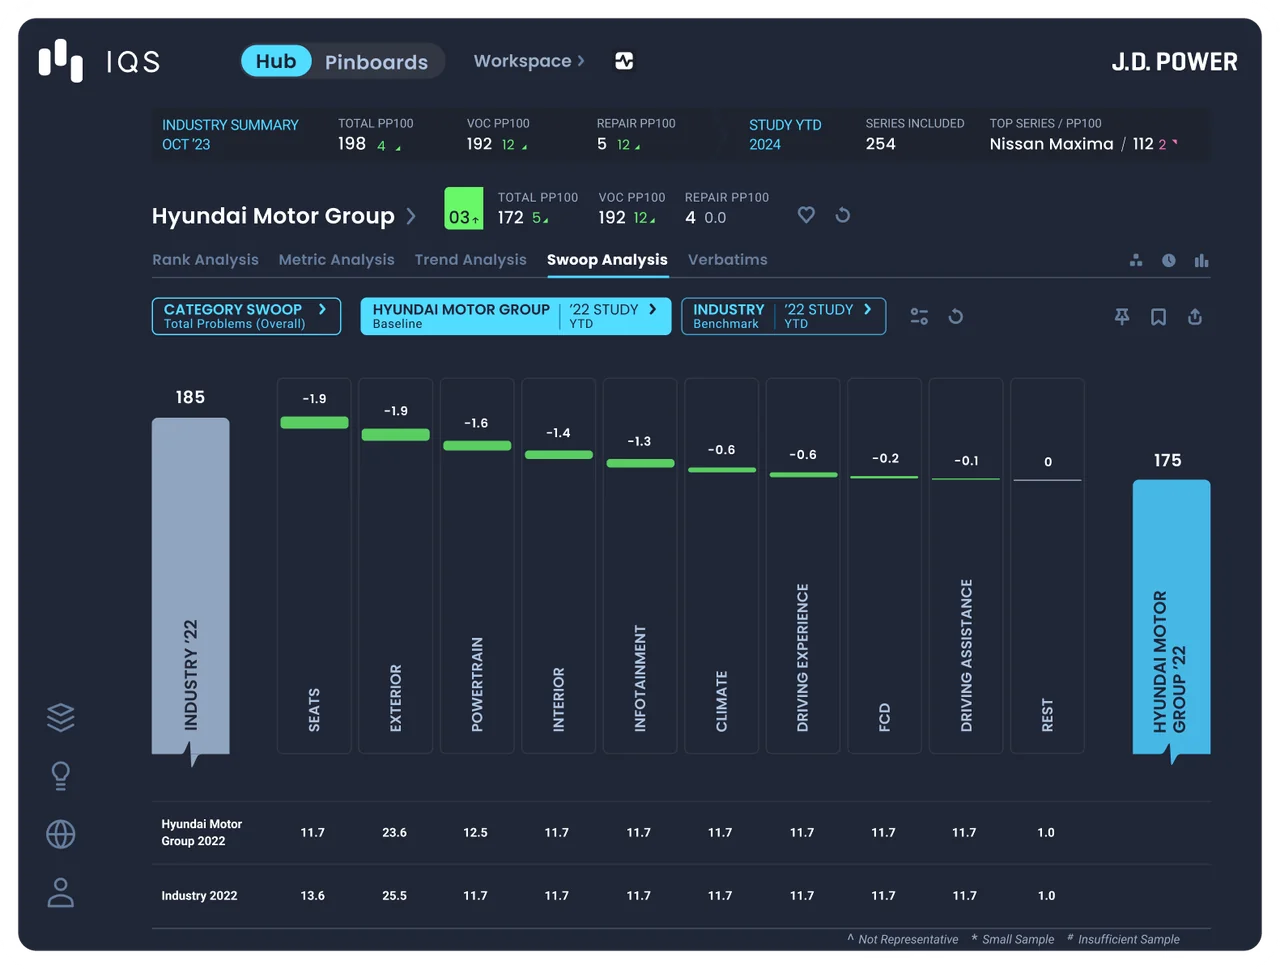
Swoop Analysis
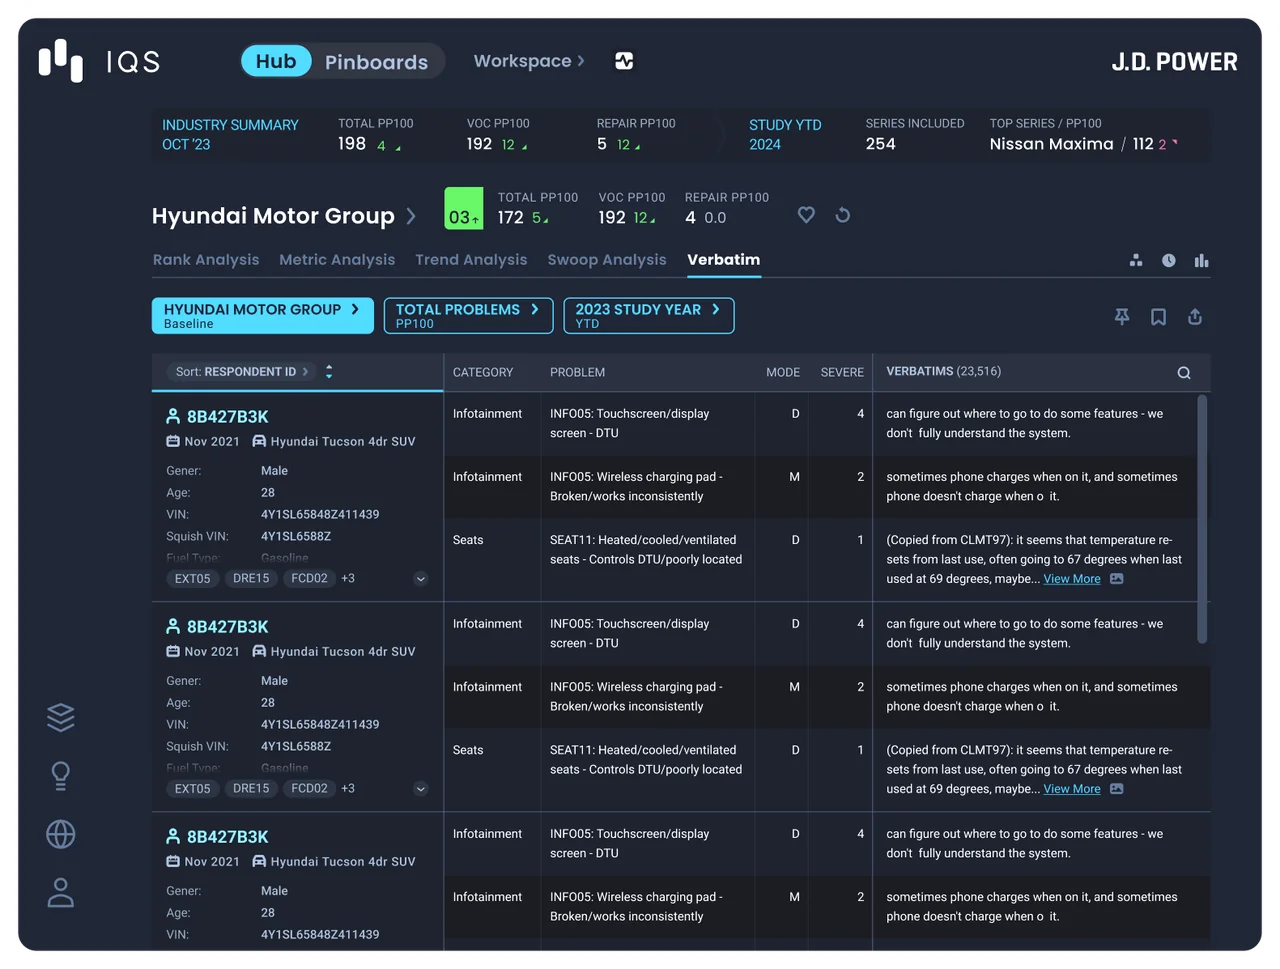
Verbatim
Rank Analysis
Metric Analysis
Trend Analysis
Swoop Analysis
Verbatim
DESIGN PROCESS
Before designing any interface, I built the information architecture. By mapping how analysts actually reason about quality data, I reorganized millions of fragmented records into a clear, layered hierarchy — turning an overwhelming dataset into predictable pathways that move from broad overview to root-cause detail.
Together, these modules turned fragmented data into an intuitive, connected ecosystem for faster, clearer decision-making.
Through client interviews and workflow mapping sessions, I uncovered how analysts and managers navigated their daily tasks. Common themes emerged—difficulty tracing insights across disconnected datasets, over dependence on static rankings, and a lack of adaptive tools to monitor changes over time.
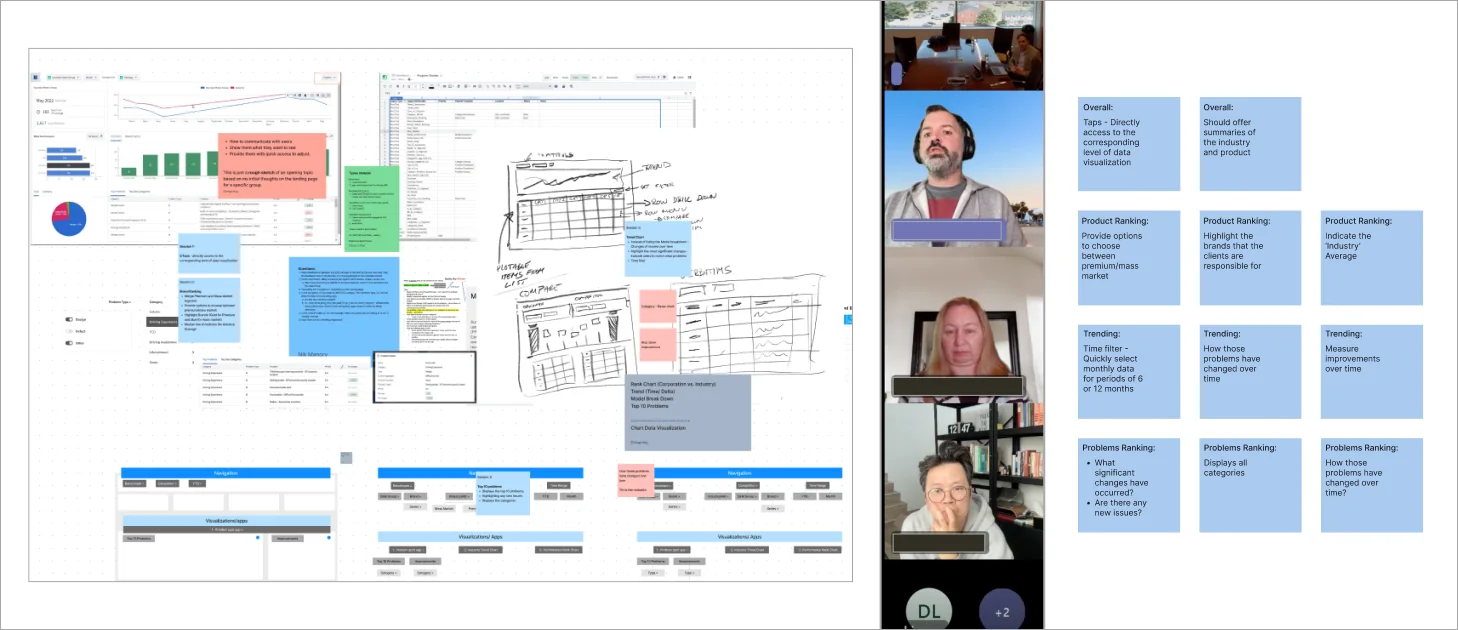
To redefine IQS, I began by mapping its existing data landscape—how legacy reports were produced, shared, and consumed across clients. This revealed a fundamental gap between static deliverables and the dynamic, real-time insights modern automotive teams need to make confident decisions.
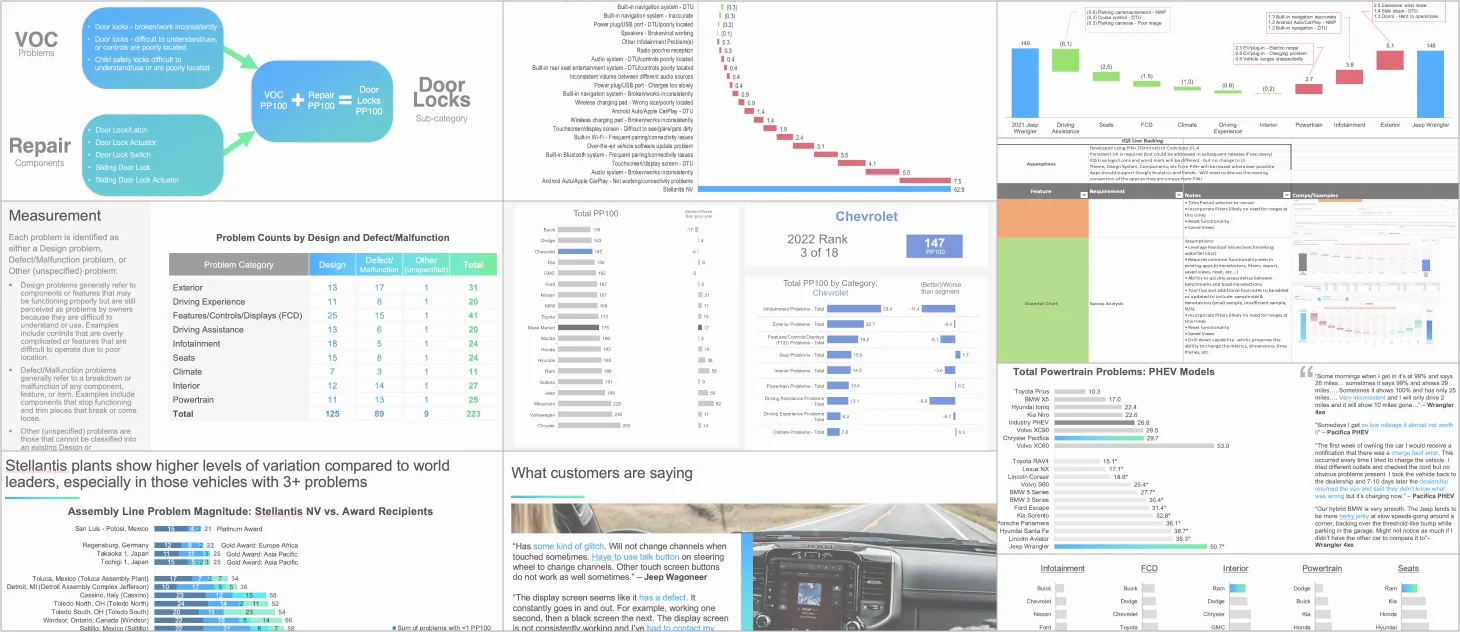
Behind that gap was a massive and fragmented dataset. We got an example dataset piece: over 180,000 individual problem cases from multiple sources. Analysts struggled to locate signals, connect categories, and trace causes efficiently. To make this complexity navigable, we needed an information structure that could classify, explore, and visualize data seamlessly—without sacrificing clarity or speed.
To transform raw inputs into a usable framework, we deconstructed these problem records into a clear hierarchy—spanning 4 problem types, 9 categories, 102 subcategories, and 223 specific issues.
This multi-level structure became the foundation of our information architecture, enabling data to be filtered, compared, and aggregated seamlessly across varying depths of analysis.
It turned what was once an overwhelming dataset into a navigable system that supported both broad overviews and granular diagnosis.
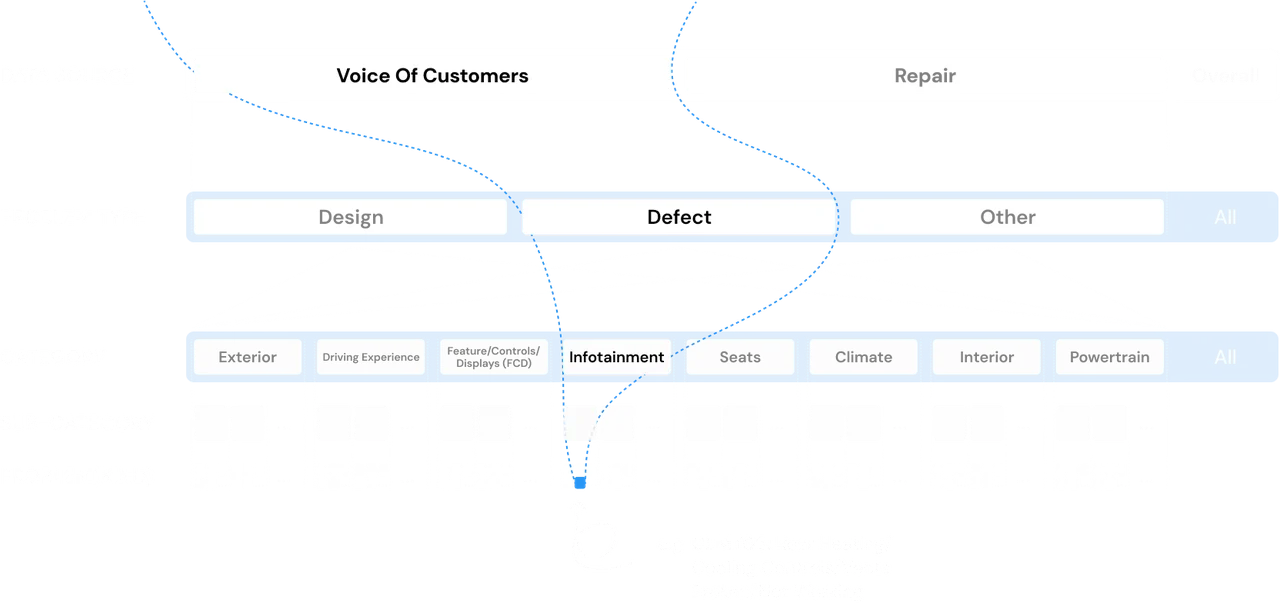
The Metric Selector is the core tool for retrieving target metrics of selected products during analysis.
For example, in Rank Analysis, it defines the standard by which different entries are ranked.
Behind the scenes, the logic resembles an SQL query — but in our software it’s simplified into two clear options:
I led the definition of this interaction model end-to-end, aligning analytical correctness, system constraints, and usability across teams.
🔎
Granularity
→ Defines the unit of measurement for ranking (e.g., Sub-Category, Problem).
🌐
Range
→ Defines the higher-level scope within which the ranking is calculated (e.g., Category, Problem Type).
To keep counts consistent, granularity must always sit below the chosen range.
e.g.
✅ Valid
Problems within Sub-Category

e.g.
❌ Invalid
Problem Types within Category
After figuring out the user needs, we start to work on the metric selector menu design.
🔎
Granularity
→ Users pick one of four levels (Problem Types, Category, Sub-Category, Problems), which is simpler.
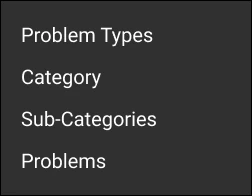
Granularity Menu Draft
🌐
Range
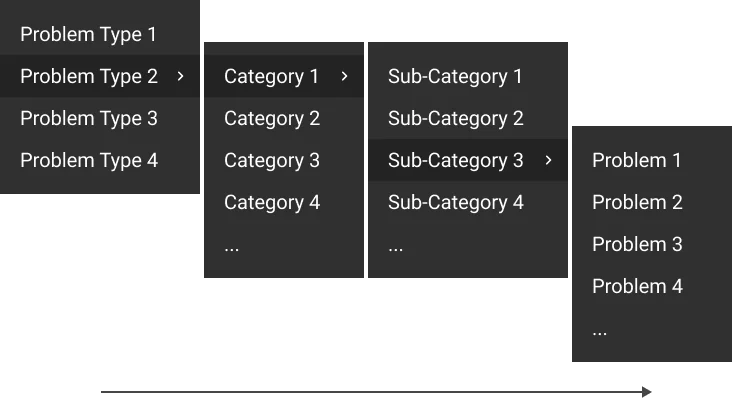
→ Users must choose actual content within the hierarchy, which is more complicated. We first came up with two options.
➡️
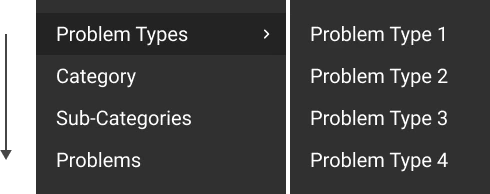
Option 1: Zoom-in
1. Works like a folder system.
2. Users dive step by step from type → category → sub-category → problem.
3. Intuitive, but panels grow horizontally and make multi-selection cumbersome.
⬇️
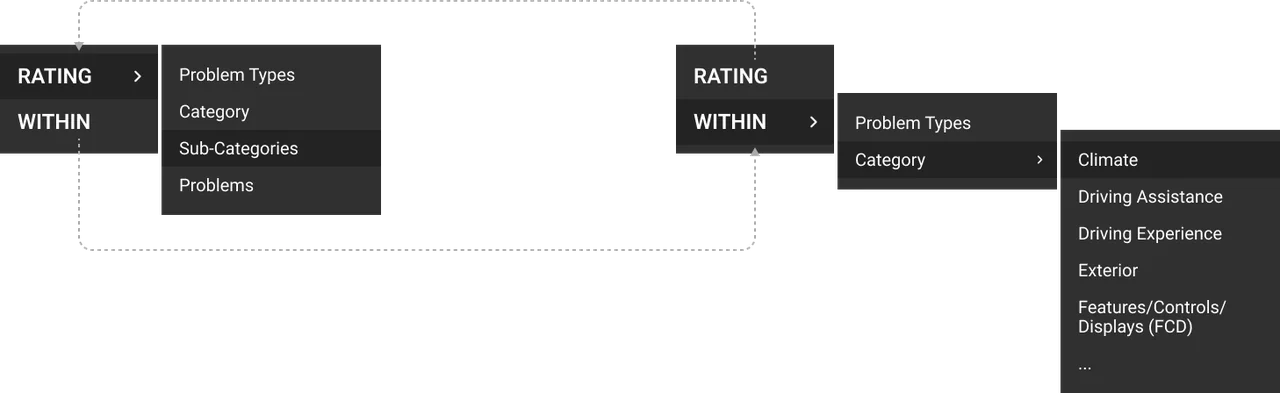
Option 2: Filter-down
1. Inspired by common filtering systems.
2. Two panels: left shows hierarchy (large → small), right shows contents within each level.
3. Selections at lower levels depend on higher-level choices.
We finally chose ⬇️ Option 2: Filter-down because:
1. It avoids infinitely expanding horizontal panels.
2. It supports multi-selection more efficiently.
3. It feels rational and simple for analysts managing large datasets.
As a result, the metric selector was designed to operate by pairing granularity (Rating) with range (Within).
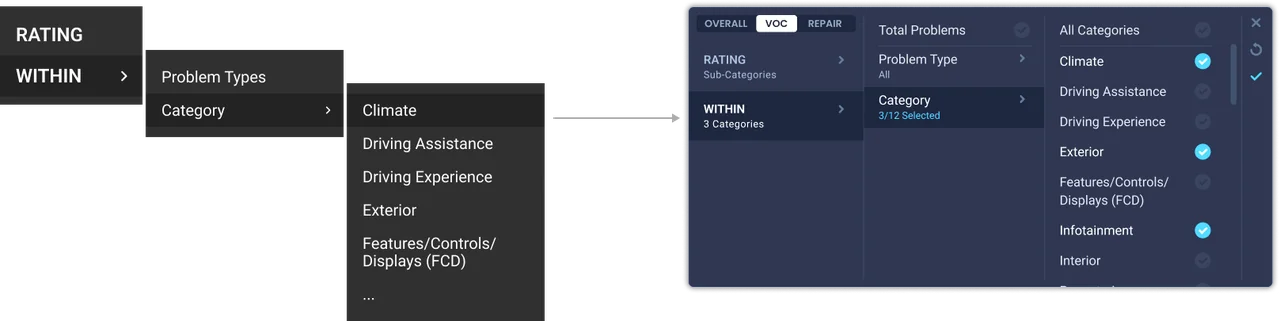
UI Polishing
After the structure was set, we refined the UI with clear hierarchies, consistent interactions, and intuitive feedback to ensure analysts could filter and navigate without friction.
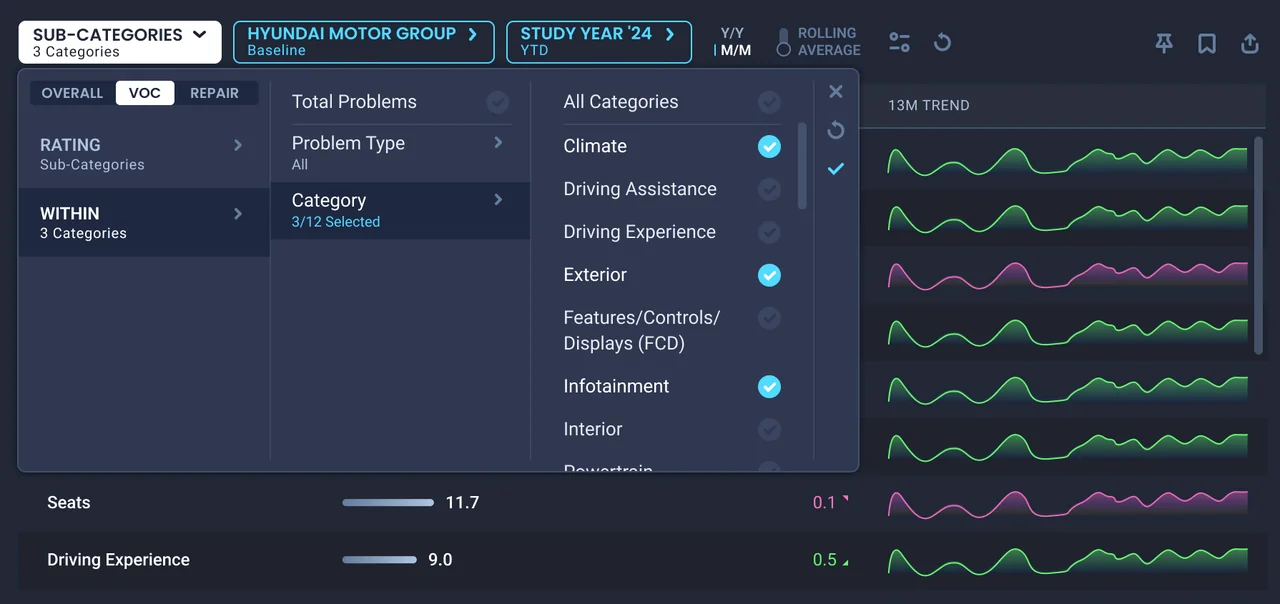
Metric Selector Active State
IMPACT
🧭
System Reliability
Established a predictable interaction model analysts could trust across scale — reducing ambiguity, misinterpretation, and rework in high-stakes decision workflows.
🚀
Speed to Insight
Reduced analysis time from 2–3 days of manual Excel work to under 30 minutes, enabling analysts to query, visualize, and validate insights instantly.
🔗
Shared Data Language
Introduced a unified taxonomy aligned across teams and regions, improving data consistency and cross-team communication by over 40%.
💡
Adoption Through Value
Achieved 85%+ voluntary adoption during pilot rollout — driven by clear value, not mandates.