UI/UX | Enterprise SaaS | Data Visualization | Motion Design

PROBLEM
CONTEXT
📂
Siloed Reports
Each report told only part of the story. Teams pieced together Excel files and PDFs from different quarters, making cross-market analysis slow and inconsistent.
📊
Outdated Formats
Most datasets arrived as fixed summaries — numbers without context, charts without interaction. Users couldn’t explore trends beyond what was predefined in the report.
🔍
Opaque Insights
Without visual exploration, complex patterns were buried in raw tables. Important changes went unnoticed until they became problems.
🔄
Manual Workload
Extracting metrics, rebuilding charts, and reformatting slides became a routine cycle — a process that consumed time but delivered little discovery.
The problem wasn’t the lack of data, but the lack of visibility.
Analysts didn’t need more reports — they needed a faster, clearer way to think with data.
To overcome these challenges, what once required multiple tools and manual steps now happens in a single place.
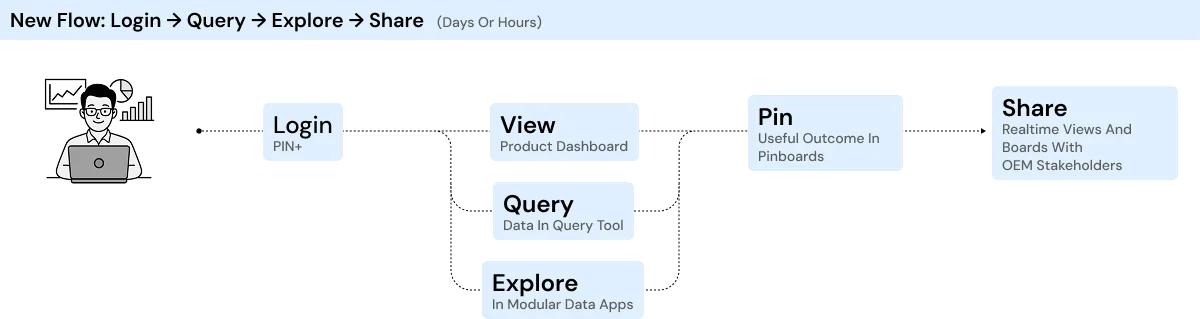
Users should be able to log in, query data, explore trends, and share insights — all in one continuous flow, without waiting for scheduled reports.
CHALLENGE & IDEATION
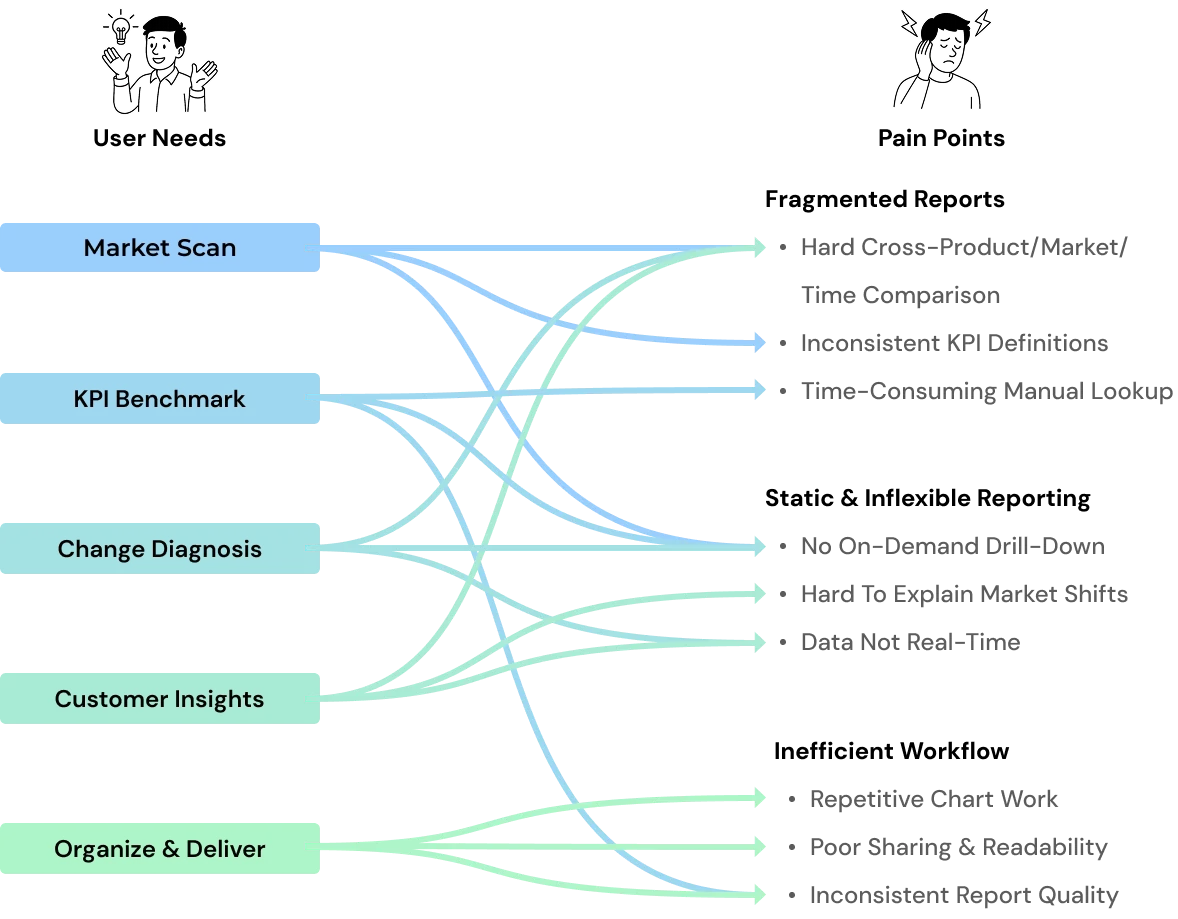
By studying analysts’ daily routines, we saw how fragmented tools and static files slowed their work.
These insights shaped our understanding of what they truly need from a modern data platform.
SOLUTION
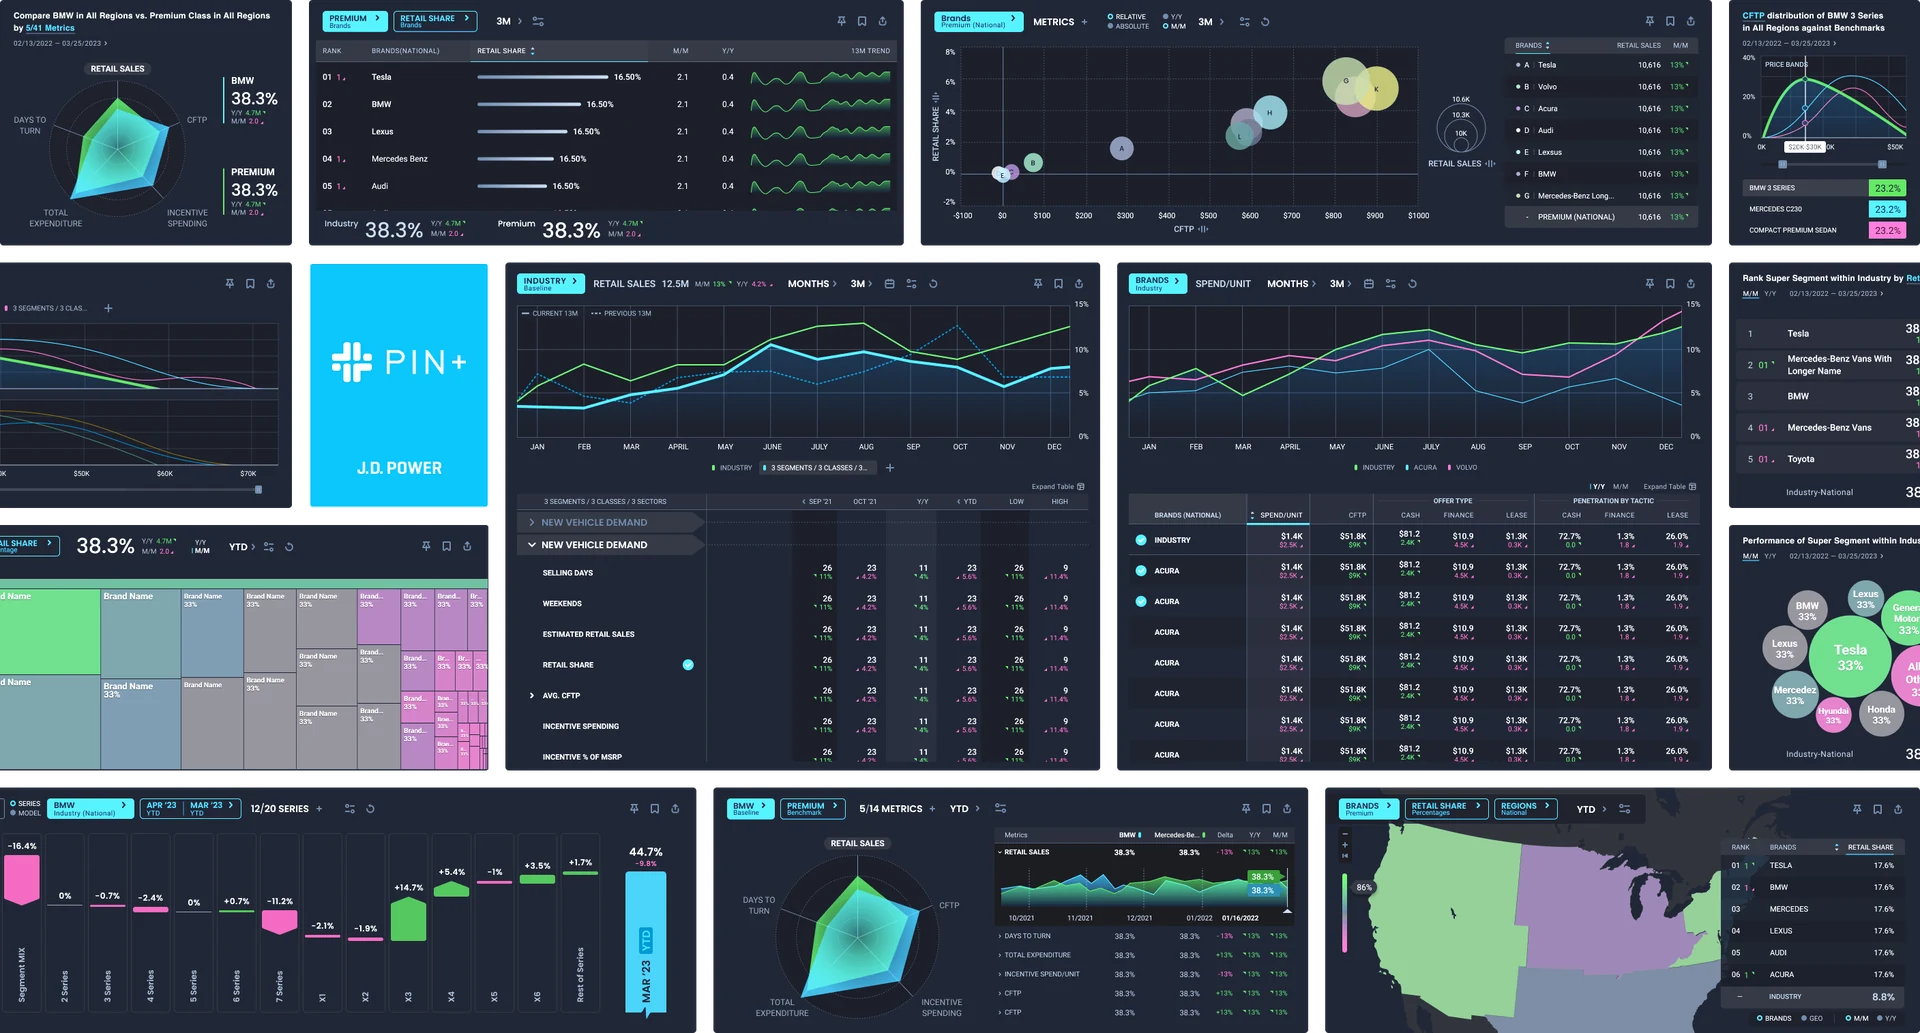
I reimagined PIN+ as a unified, real-time analytics platform — consolidating fragmented sales, configuration, and incentive data into interactive dashboards that OEM analysts can explore, compare, and act on in one place.
🐢
Before:
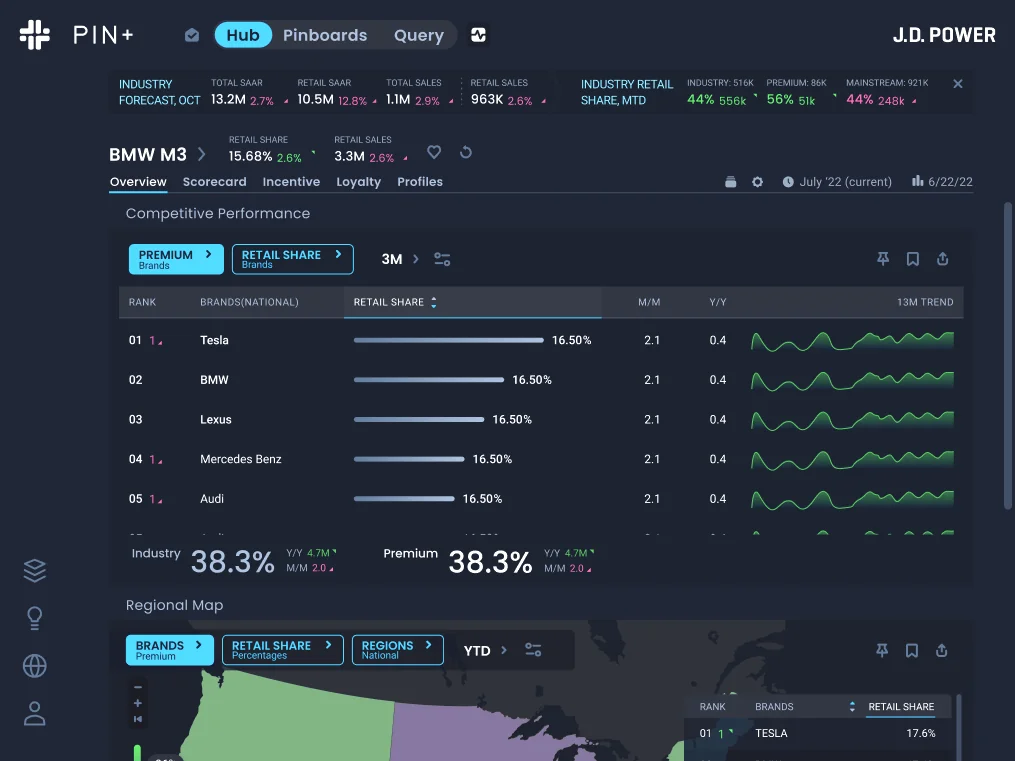
Insights were buried in disconnected Excel sheets and PDF decks, slowing down cross-market evaluation and decision cycles.
🚀
Now:
A unified platform consolidates all metrics into one interactive view — with consistent KPIs and instant drill-down, giving analysts faster, clearer answers.
🐢
Before:
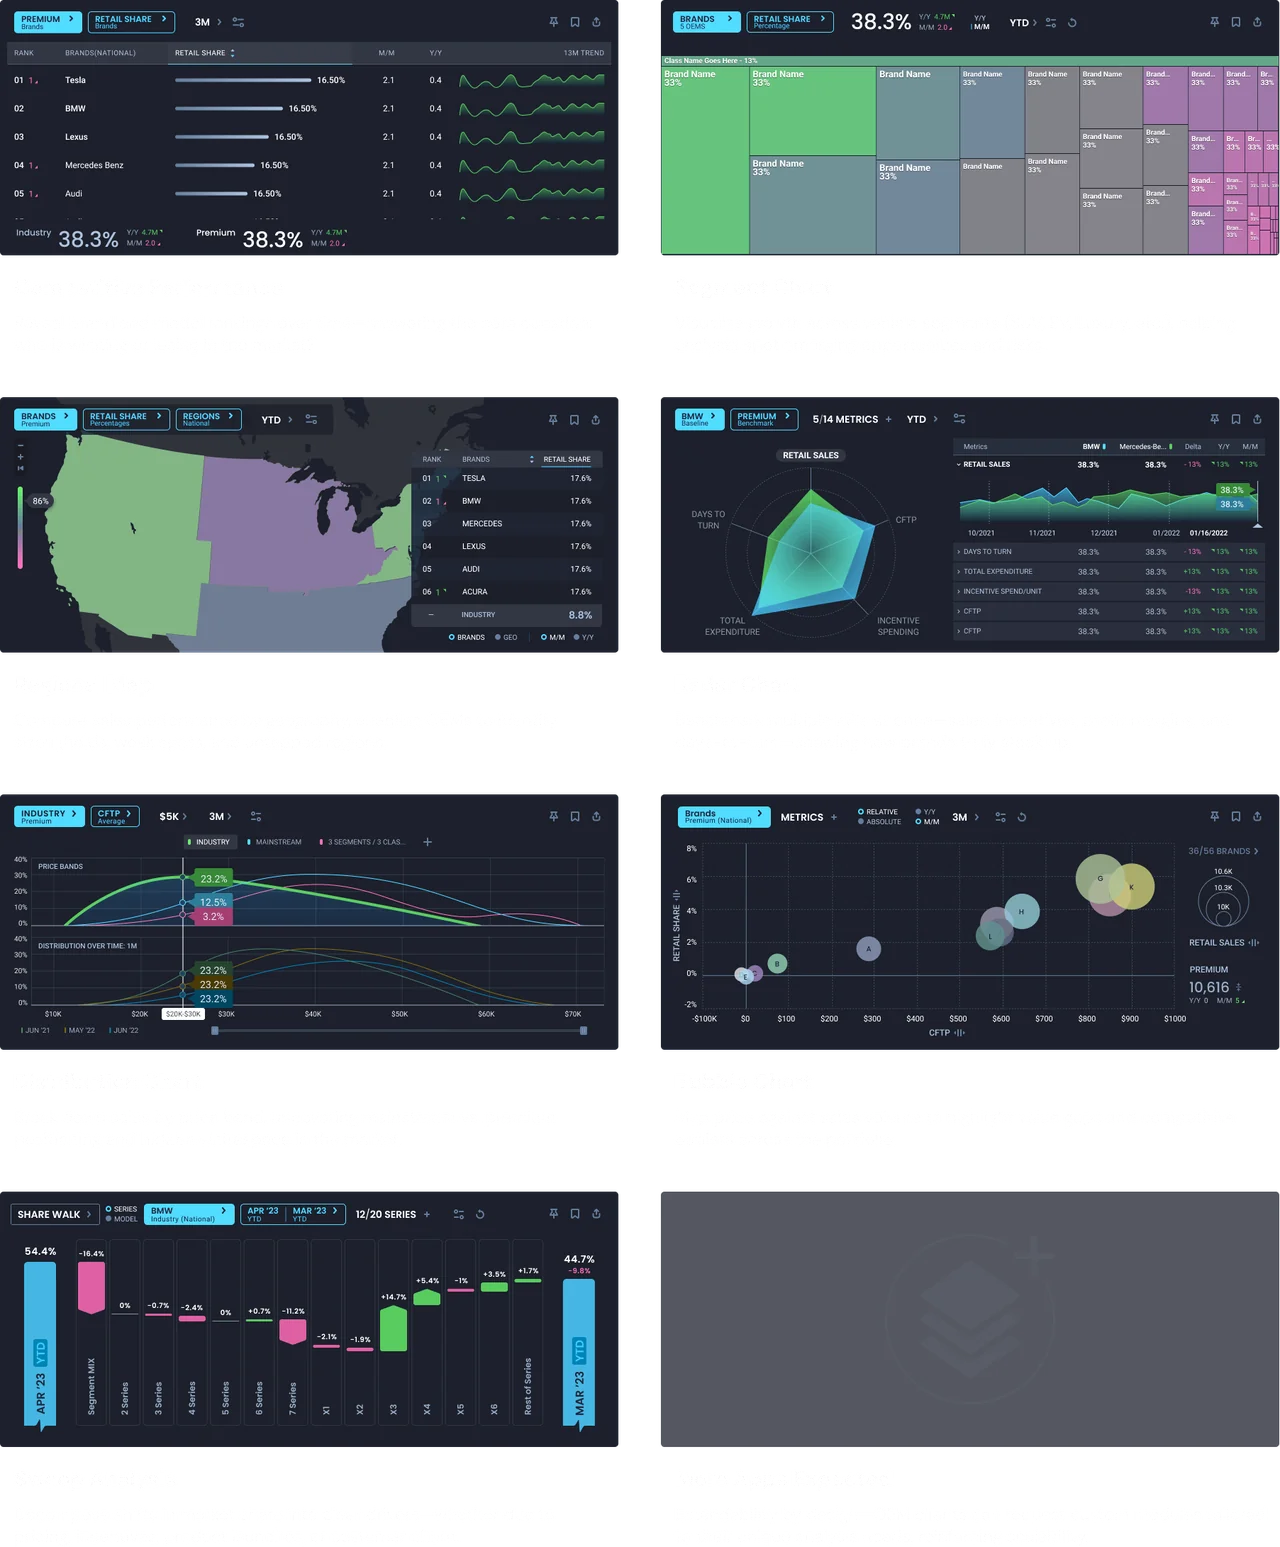
Fixed reports showed outcomes but failed to explain what caused them.
🚀
Now:
Modular tools—like ranking, segmentation, and mapping—empower teams to slice data dynamically, trace root causes, and discover trends in real time.
🐢
Before:
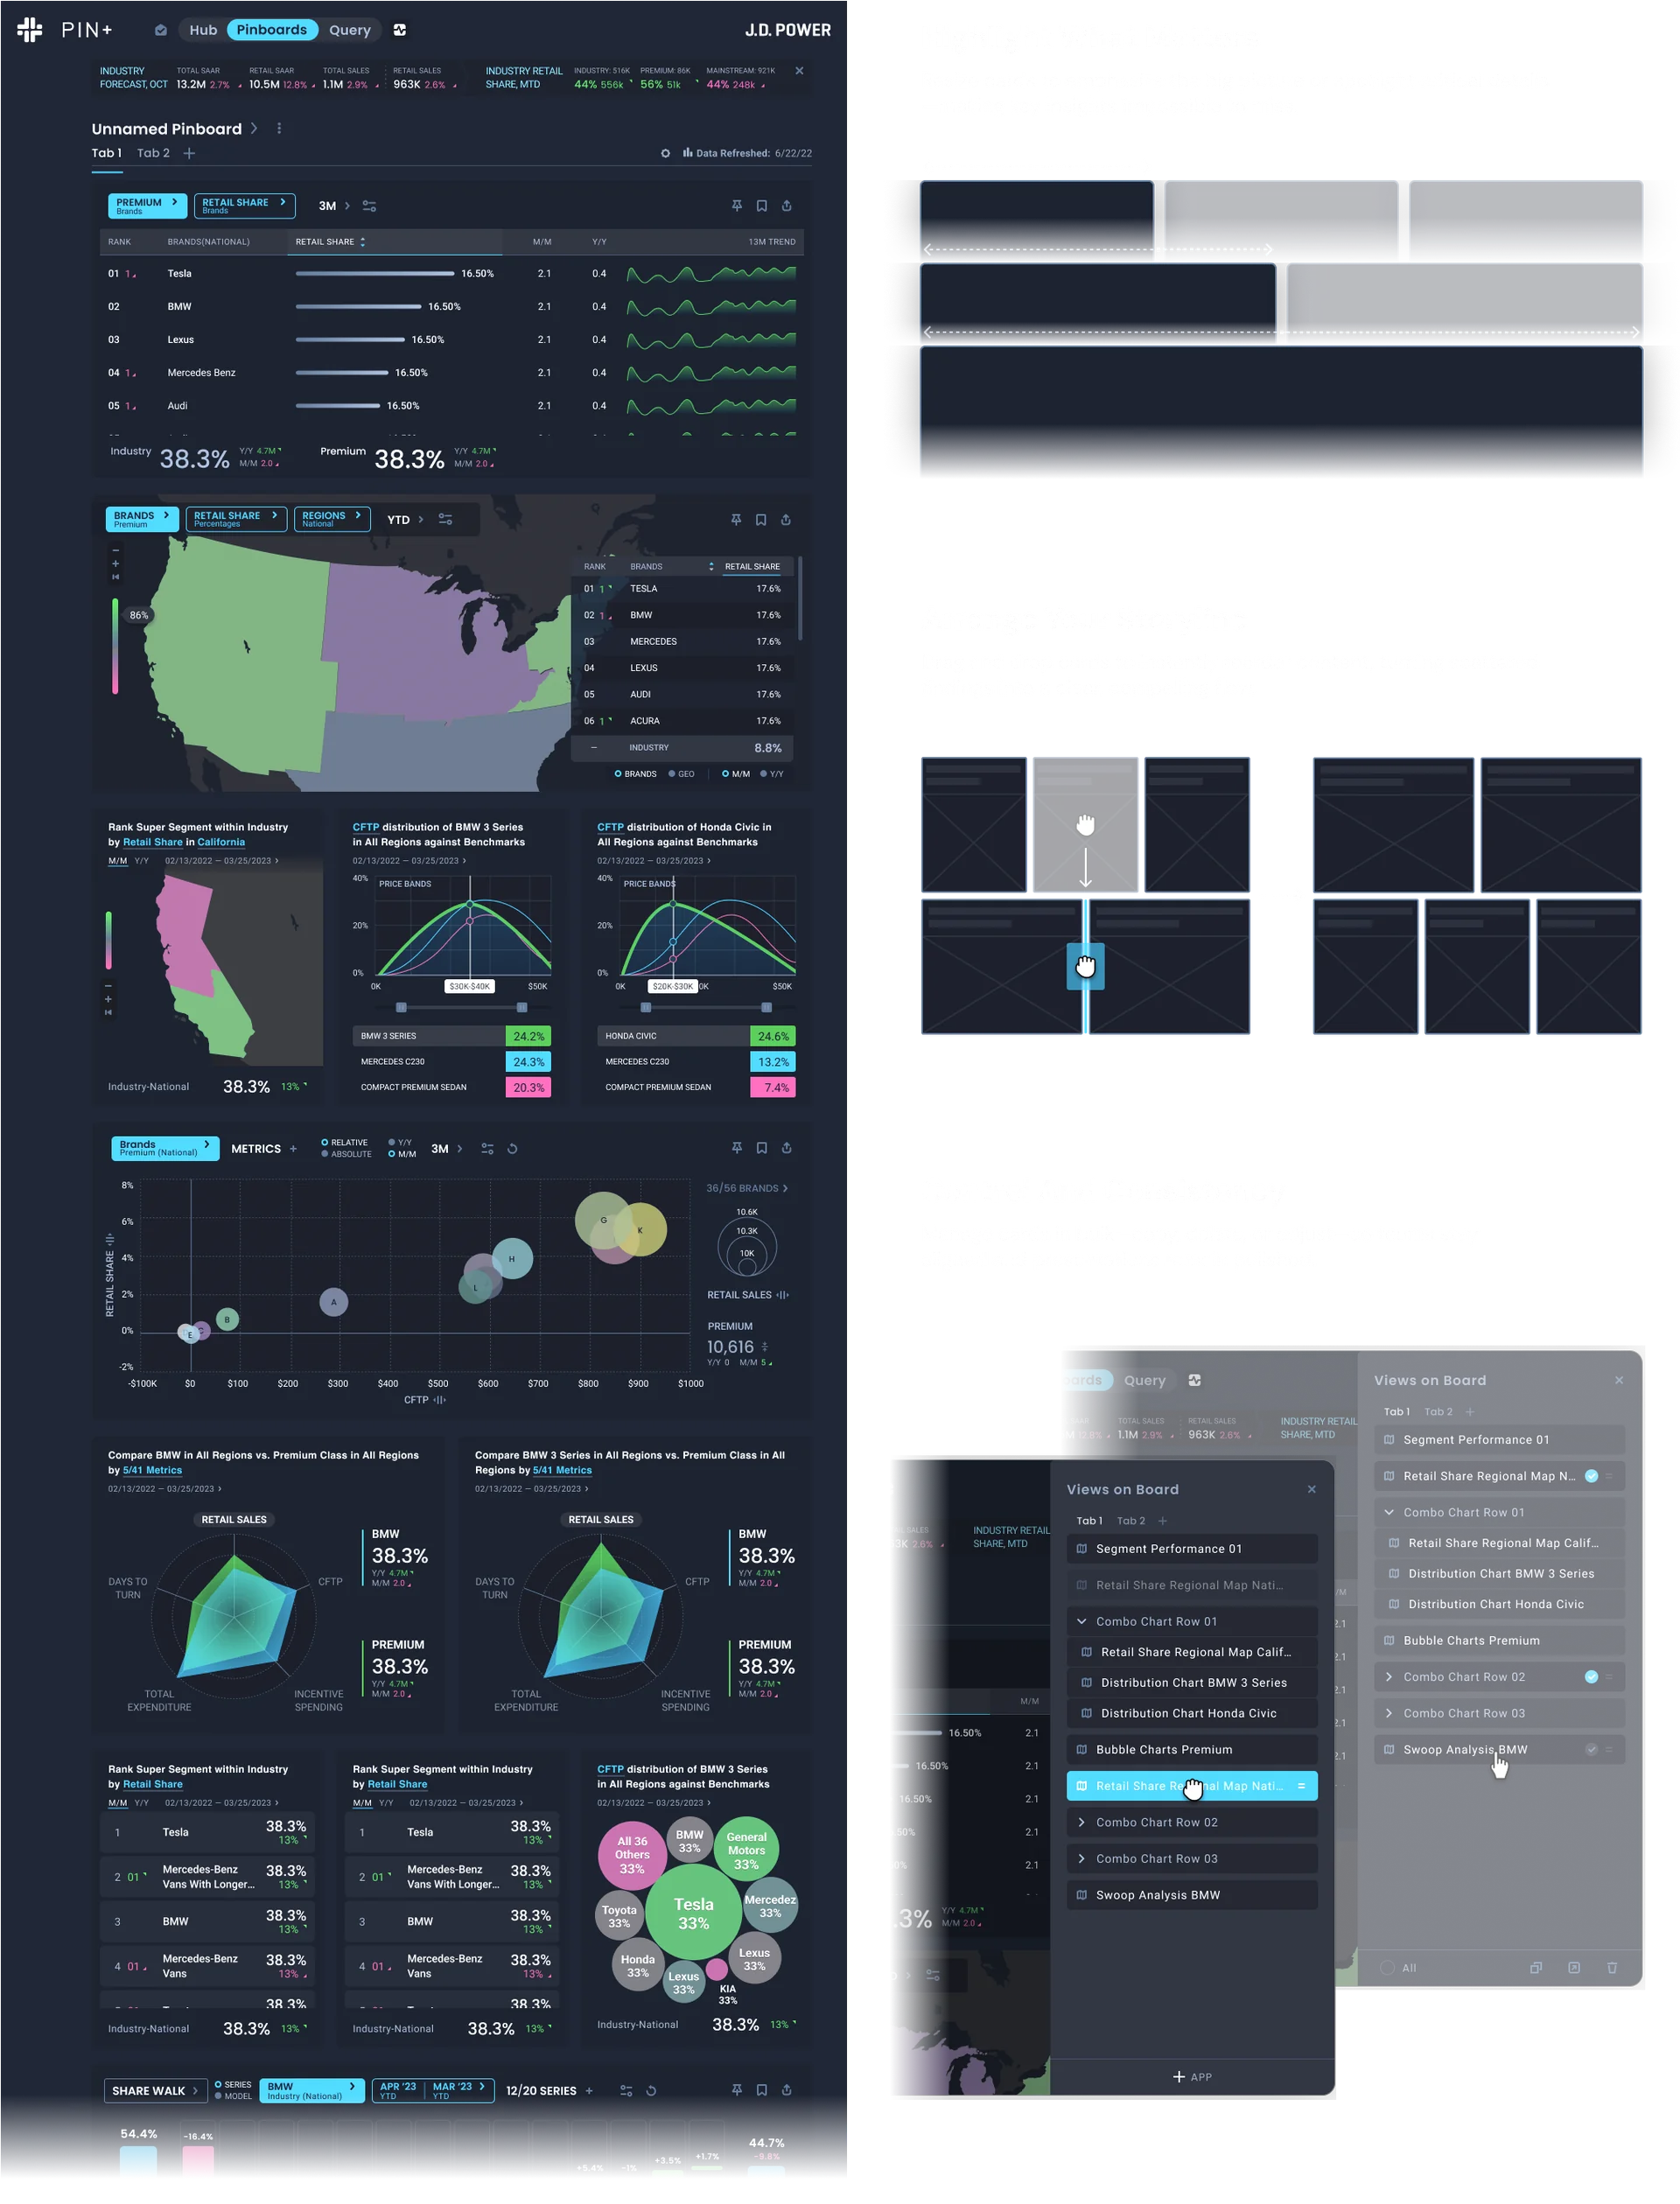
Findings lived inside decks and email threads—disconnected, static, and hard to align across teams.
🚀
Now:
Pinboards transform insights into living stories—organized, visual, and ready to share with anyone in real time.
🐢
Before:
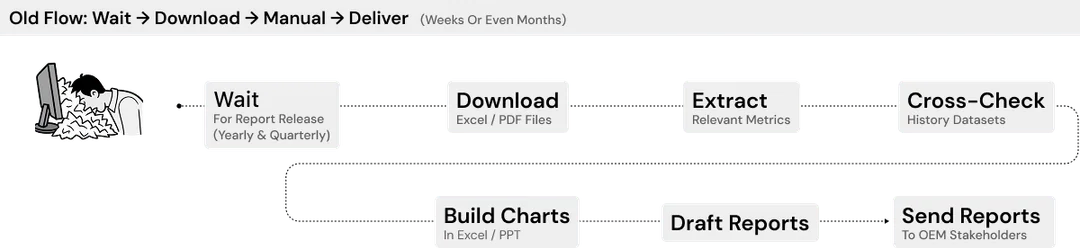
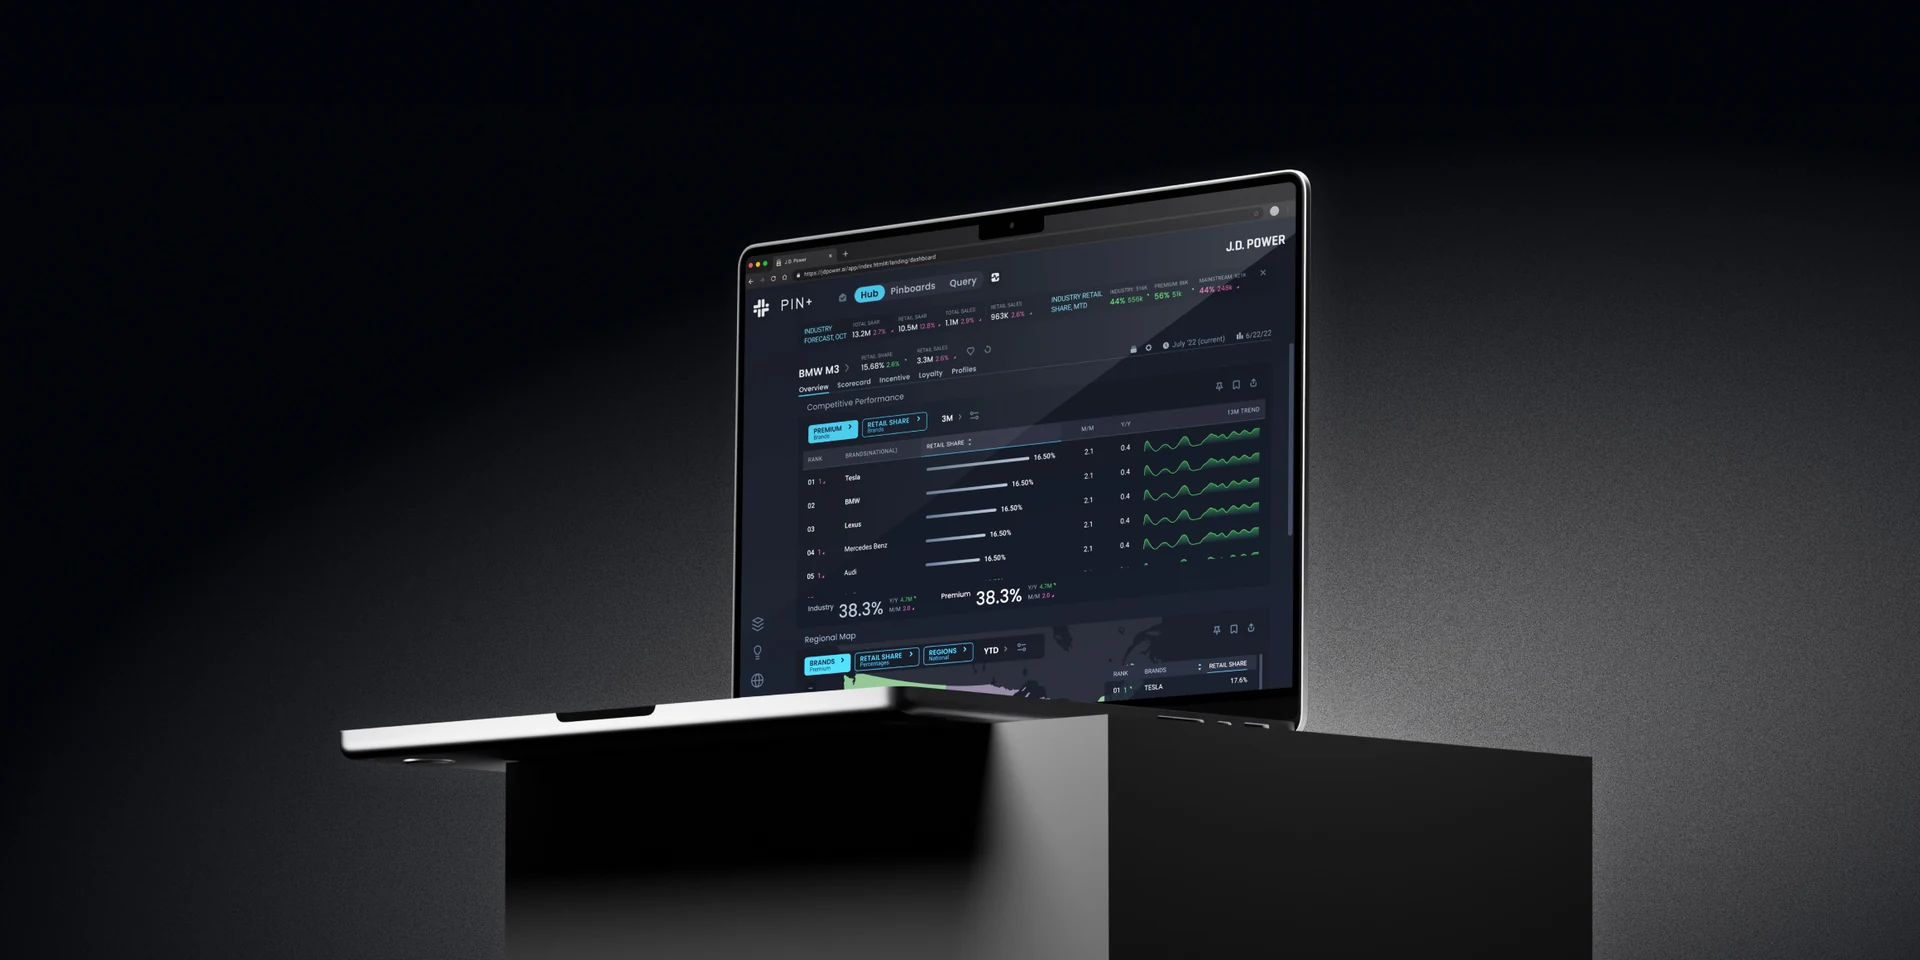
Reports arrived weeks or even months late, leaving analysts reacting to the past instead of shaping the present.
🚀
Now:
Dashboards refresh automatically with live data, keeping every decision aligned with the latest market movement.
IMPACT
🚀
Business Impact
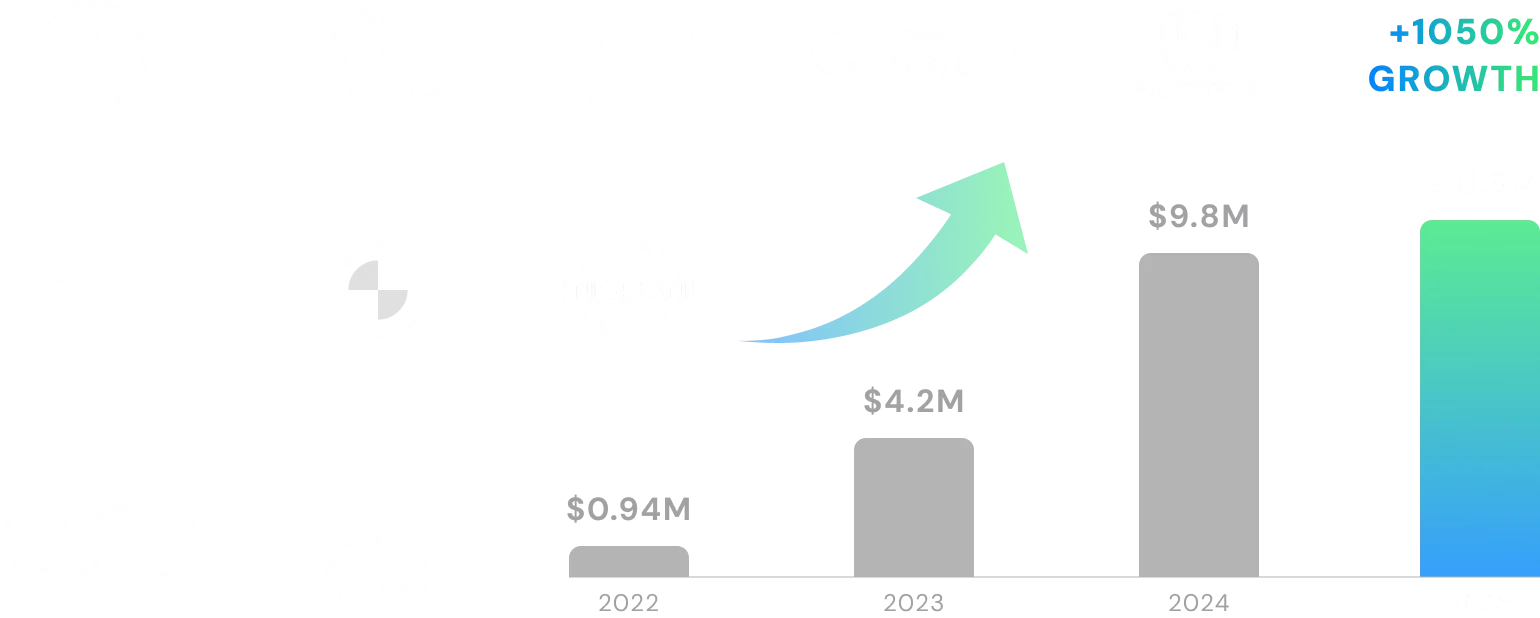
Revenue grew 10× in three years — driven by modular subscriptions and Tier-1 OEM adoption across 20+ automakers.
👩
User Efficiency
Analysts who once spent weeks on static reports now explore live dashboards and complete deep-dive analyses in hours.
🧱
Platform Foundation
PIN+ became J.D. Power’s core design and data architecture, powering new vertical platforms and partner integrations.